UK Parliament constituency in England since 1950
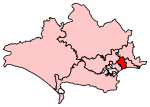
Bournemouth West Borough constituencyfor the House of Commons Boundary of Bournemouth West in Dorset
Location of Dorset within England
County Dorset Population 98,968 (2011 census)[1] Electorate 71,920 (2018)[2] Current constituency Created 1950 Member of Parliament Conor Burns (Conservative) Seats One Created from Bournemouth
Bournemouth West is a parliamentary constituency [n 1] House of Commons of the UK Parliament since 2010 by Conor Burns, a Conservative.
Constituency profile The seat covers Bournemouth Town Centre and the northern suburbs.
Residents are younger and slightly less wealthy than in neighbouring Bournemouth East.[3]
Boundaries 1950–1974 : The County Borough of Bournemouth wards of Central, East Cliff, Kinson, Moordown North, Moordown South, Redhill Park, Westbourne, West Cliff, and Winton.
Bournemouth West 1974–1983 in Hampshire 1974–1983 : The County Borough of Bournemouth wards of Central, East Cliff, Kinson North, Kinson South, Redhill Park, Westbourne, West Cliff, and Winton.
1983–1997 : The Borough of Bournemouth wards of Ensbury Park, Kinson, Redhill Park, Talbot Woods, Wallisdown, Westbourne, West Cliff, and Winton, and the Borough of Poole wards of Alderney, Bourne Valley, and Canford Magna.
1997–2010 : The Borough of Bournemouth wards of Central, East Cliff, Ensbury Park, Kinson, Redhill Park, Talbot Woods, Wallisdown , Westbourne , West Cliff , and Winton .
2010–2019 : The Borough of Bournemouth wards of Central, Kinson North, Kinson South, Redhill and Northbourne, Talbot and Branksome Woods, Wallisdown and Winton West, Westbourne and West Cliff , and Winton East, and the Borough of Poole wards of Alderney and Branksome East.
2019–present : Bournemouth, Christchurch and Poole wards of Alderney and Bourne Valley, Bournemouth Central, Kinson, Redhill and Northbourne, Talbot and Branksome Woods, Wallisdown and Winton West, Westbourne and West Cliff, Winton East[4]
The constituency includes the western portion of Bournemouth , from the Kinson , Ensbury Park , Alder Hills , Winton and Talbot Woods areas down towards the town centre and the West Cliff . Following a boundary change for the 2010 general election, the constituency gained the Branksome area from Poole whilst losing East Cliff to the neighbouring Bournemouth East constituency.
The constituency contains Labour's best ward in Bournemouth in the district of Kinson , but the seat has elected Conservatives at every election since its creation in 1950 ; therefore it is considered a Conservative safe seat.
Map of present boundaries
With the exception of the period 1983–1997 (when it was in Bournemouth East), Bournemouth Town Centre has been in this constituency since its creation in 1950.
Proposed Further to the 2023 Periodic Review of Westminster constituencies , enacted by the Parliamentary Constituencies Order 2023, from the 2024 general election , the constituency will be composed of the following (as they existed on 1 December 2020):
The District of Bournemouth, Christchurch and Poole wards of: Alderney & Bourne Valley; Bournemouth Central; Kinson; Redhill & Northbourne; Talbot & Branksome Woods; Wallisdown & Winton West; Westbourne & West Cliff; Winton East.[5] Minor changes following re-organisation of local authorities and wards in Dorset.
Members of Parliament Elections Elections in the 2020s Elections in the 2010s General election 2019 : Bournemouth West[14] Party Candidate Votes % ±% Conservative Conor Burns 24,550 53.4 ―0.1 Labour David Stokes 14,400 31.3 ―4.9 Liberal Democrats Jon Nicholas 4,931 10.7 +4.1 Green Simon Bull 2,096 4.6 +1.8 Majority 10,150 22.1 +4.8 Turnout 45,977 62.0 +1.2 Conservative hold Swing +2.4
General election 2017 : Bournemouth West[15] Party Candidate Votes % ±% Conservative Conor Burns 23,812 53.5 +5.3 Labour David Stokes 16,101 36.2 +18.5 Liberal Democrats Phil Dunn 2,929 6.6 ―1.3 Green Simon Bull 1,247 2.8 ―4.6 Pirate Jason Halsey 418 0.9 New Majority 7,711 17.3 ―12.4 Turnout 44,507 60.8 +2.8 Conservative hold Swing ―6.6
General election 2015 : Bournemouth West Party Candidate Votes % ±% Conservative Conor Burns 20,155 48.2 +3.1 UKIP Martin Houlden 7,745 18.5 +11.3 Labour David Stokes 7,386 17.7 +2.9 Liberal Democrats Mike Plummer 3,281 7.9 ―23.8 Green Elizabeth McManus 3,107 7.4 New Patria Dick Franklin 99 0.2 New Majority 12,410 29.7 +16.3 Turnout 41,767 58.0 ―0.1 Conservative hold Swing
General election 2010 : Bournemouth West[16] Party Candidate Votes % ±% Conservative Conor Burns 18,808 45.1 +5.6 Liberal Democrats Alasdair Murray 13,225 31.7 -0.2 Labour Sharon Carr-Brown 6,171 14.8 -8.1 UKIP Philip Glover 2,999 7.2 +1.6 Independent Harvey Taylor 456 1.1 New Majority 5,583 13.4 +1.5 Turnout 41,659 58.1 +4.2 Conservative hold Swing +2.9
Elections in the 2000s General election 2005 : Bournemouth West[17] Party Candidate Votes % ±% Conservative John Butterfill 14,057 41.4 −1.4 Liberal Democrats Richard Renaut 10,026 29.6 +4.4 Labour Dafydd Williams 7,824 23.1 −5.7 UKIP Michael Maclaire-Hillier 2,017 5.9 +2.7 Majority 4,031 11.8 -2.2 Turnout 33,924 53.3 +0.1 Conservative hold Swing -2.9
General election 2001 : Bournemouth West[18] Party Candidate Votes % ±% Conservative John Butterfill 14,417 42.8 +1.1 Labour David Stokes 9,699 28.8 +4.2 Liberal Democrats Fiona Hornby 8,468 25.2 −2.6 UKIP Cynthia Blake 1,064 3.2 +2.5 Majority 4,718 14.0 +0.1 Turnout 33,648 53.2 -13.0 Conservative hold Swing
Elections in the 1990s General election 1997 : Bournemouth West[19] Party Candidate Votes % ±% Conservative John Butterfill 17,115 41.7 Liberal Democrats Janet Dover 11,405 27.8 Labour Dennis Gritt 10,093 24.6 Referendum Ronald Mills 1,910 4.7 New UKIP Linda Tooley 281 0.7 New BNP John Morse 165 0.4 New Natural Law Alexander Springham 103 0.3 Majority 5,710 13.9 Turnout 41,072 66.21 Conservative hold Swing -5.6
General election 1992 : Bournemouth West[20] [21] Party Candidate Votes % ±% Conservative John Butterfill 29,820 52.7 −2.5 Liberal Democrats Janet Dover 17,117 30.2 −1.8 Labour Ben Grower 9,423 16.7 +3.9 Natural Law Alexander Springham 232 0.4 New Majority 12,703 22.5 −0.7 Turnout 56,592 75.7 +2.4 Conservative hold Swing −0.4
Elections in the 1980s General election 1987 : Bournemouth West[22] Party Candidate Votes % ±% Conservative John Butterfill 30,117 55.2 -1.7 SDP Peter Craven 17,466 32.0 +1.7 Labour Ronald Jones 7,018 12.8 +0.3 Majority 12,651 23.2 -3.4 Turnout 54,601 73.4 -4.2 Conservative hold Swing -1.7
General election 1983 : Bournemouth West[23] Party Candidate Votes % ±% Conservative John Butterfill 28,466 56.9 Liberal Michael James 15,135 30.3 Labour Kelvin Horrocks 6,243 12.5 BNP John Morse 180 0.3 New Majority 13,331 26.6 Turnout 50,024 69.2 Conservative hold Swing
Elections in the 1970s General election 1979 : Bournemouth West Party Candidate Votes % ±% Conservative John Eden 25,873 59.84 Labour Peter J. Brushett 9,247 21.39 Liberal Terence D. G. Richards 7,677 17.76 National Front G Hubbard 438 1.01 New Majority 16,626 38.45 Turnout 43,235 70.46 Conservative hold Swing
General election October 1974 : Bournemouth West Party Candidate Votes % ±% Conservative John Eden 21,294 50.67 Labour Lionel F Bennett 10,566 25.14 Liberal Terence D. G. Richards 10,166 24.19 Majority 10,728 25.53 Turnout 42,026 68.66 Conservative hold Swing
General election February 1974 : Bournemouth West Party Candidate Votes % ±% Conservative John Eden 23,473 50.82 Liberal Terence D. G. Richards 12,655 27.40 Labour Lionel F Bennett 10,062 21.78 Majority 10,818 23.42 Turnout 46,190 76.06 Conservative hold Swing
General election 1970 : Bournemouth West Party Candidate Votes % ±% Conservative John Eden 28,714 56.17 Labour Lionel F Bennett 14,099 27.58 Liberal John Fuller Mills 8,303 16.24 Majority 13,615 28.59 Turnout 51,116 69.28 Conservative hold Swing
Elections in the 1960s General election 1966 : Bournemouth West Party Candidate Votes % ±% Conservative John Eden 25,740 50.02 Labour Lionel F Bennett 16,334 31.74 Liberal John F Mills 9,389 18.24 Majority 9,406 18.28 Turnout 51,463 73.37 Conservative hold Swing
General election 1964 : Bournemouth West Party Candidate Votes % ±% Conservative John Eden 26,114 50.44 Labour George W Spicer 13,975 26.99 Liberal John F Mills 11,681 22.56 New Majority 12,139 23.45 Turnout 51,770 73.71 Conservative hold Swing
Elections in the 1950s General election 1959 : Bournemouth West Party Candidate Votes % ±% Conservative John Eden 33,575 67.78 Labour George W Spicer 15,957 32.22 Majority 17,618 35.56 Turnout 49,532 72.62 Conservative hold Swing
General election 1955 : Bournemouth West Party Candidate Votes % ±% Conservative John Eden 31,931 67.83 Labour Charles Ford 15,147 32.17 Majority 16,784 35.66 Turnout 47,078 71.71 Conservative hold Swing
See also Notes References ^ "Bournemouth West: Usual Resident Population, 2011". Neighbourhood Statistics . Office for National Statistics. Archived from the original on 1 February 2015. Retrieved 1 February 2015 . ^ "England Parliamentary electorates 2010–2018". Boundary Commission for England. Retrieved 27 September 2020 . ^ Electoral Calculus https://www.electoralcalculus.co.uk/fcgi-bin/seatdetails.py?seat=Bournemouth+West ^ "Initial proposals for new Parliamentary constituency boundaries in the South West region | Boundary Commission for England | Page 7". boundarycommissionforengland.independent.gov.uk . Retrieved 16 October 2021 . ^ "The Parliamentary Constituencies Order 2023". Schedule 1 Part 7 South West region. ^ Leigh Rayment's Historical List of MPs – Constituencies beginning with "B" (part 4) ^ Conor Burns [@ConorBurnsUK] (22 January 2022). "I was honoured to be unanimously readopted as Parliamentary candidate for Bournemouth West last night. Today I enjoyed a long walk and then spent time delivering my survey. Talking to constituents they were encouraging & supportive. Perspective that isn't always on display in SW1" (Tweet) – via Twitter .^ "Liberal Democrat Prospective Parliamentary Candidates". Mark Pack . Retrieved 28 February 2024 . ^ "General election 2024". Retrieved 3 June 2024 . ^ "Stand at the next general election". South West Green Party . 17 September 2023. Retrieved 28 February 2024 . ^ "Bournemouth West Constituency". Reform UK . Retrieved 28 February 2024 . ^ "Labour selections: parliamentary candidates selected so far for the general election". LabourList . Retrieved 28 February 2024 . ^ "GENERAL ELECTION CANDIDATES". SDP. Retrieved 28 February 2024 . ^ "Statement of Persons Nominated" (PDF) . ^ "Bournemouth West parliamentary constituency". BBC News . ^ "Election Data 2010". Electoral Calculus . Archived from the original on 26 July 2013. Retrieved 17 October 2015 . ^ "Election Data 2005". Electoral Calculus . Archived from the original on 15 October 2011. Retrieved 18 October 2015 . ^ "Election Data 2001". Electoral Calculus . Archived from the original on 15 October 2011. Retrieved 18 October 2015 . ^ "Election Data 1997". Electoral Calculus . Archived from the original on 15 October 2011. Retrieved 18 October 2015 . ^ "Election Data 1992". Electoral Calculus . Archived from the original on 15 October 2011. Retrieved 18 October 2015 . ^ "Politics Resources". Election 1992 . Politics Resources. 9 April 1992. Archived from the original on 24 July 2011. Retrieved 6 December 2010 . ^ "Election Data 1987". Electoral Calculus . Archived from the original on 15 October 2011. Retrieved 18 October 2015 . ^ "Election Data 1983". Electoral Calculus . Archived from the original on 15 October 2011. Retrieved 18 October 2015 . External links nomis Constituency Profile for Bournemouth West — presenting data from the ONS annual population survey and other official statistics. Conservative (45) Bournemouth East Bournemouth West Bridgwater and West Somerset Camborne and Redruth Central Devon Cheltenham Chippenham Christchurch Devizes East Devon Filton and Bradley Stoke Forest of Dean Gloucester Mid Dorset and North Poole Newton Abbot North Cornwall North Devon North Dorset North East Somerset North Somerset North Swindon North Wiltshire Plymouth Moor View Poole Salisbury South Dorset South East Cornwall South Swindon South West Devon South West Wiltshire St Austell and Newquay St Ives Stroud Taunton Deane Tewkesbury The Cotswolds Thornbury and Yate Torbay Torridge and West Devon Totnes Truro and Falmouth Wells West Dorset Weston-super-Mare Yeovil Labour (7) Bristol East Bristol North West Bristol South Bristol West Exeter Kingswood Plymouth Sutton and Devonport Liberal Democrats (3) Bath Somerton and Frome Tiverton and Honiton East Midlands East of England London North East England North West England Northern Ireland Scotland South East England South West England Wales West Midlands Yorkshire and the Humber
Authority control databases: People
50°43′01″N 1°54′47″W / 50.717°N 1.913°W / 50.717; -1.913