English election
1979 Braintree District Council election
|
|
All 58 seats to Braintree District Council
30 seats needed for a majority |
|---|
| Turnout | 77.6% ( 28.3%) 28.3%) |
|---|
| | First party | Second party | Third party | | |  | | | | Party | Conservative | Labour | Independent | | Last election | 39 seats, 48.0% | 8 seats, 34.0% | 8 seats, 9.0% | | Seats won | 28 | 17 | 7 | | Seat change |  11 11 | 9 | 1 | | Popular vote | 54,148 | 42,436 | 6,068 | | Percentage | 46.5% | 36.5% | 5.2% | | Swing | 1.5% | 2.5% | 3.8% |
| | | Fourth party | Fifth party | Sixth party | | | | | | | Party | Liberal | Residents | Ind. Conservative | | Last election | 1 seat, 6.2% | 1 seat, 2.4% | 1 seat, 0.0% | | Seats won | 3 | 2 | 1 | | Seat change | 2 | 1 |  | | Popular vote | 9,855 | 2,797 | 408 | | Percentage | 8.5% | 2.4% | 0.4% | | Swing | 2.3% | 0.0% | N/A | |
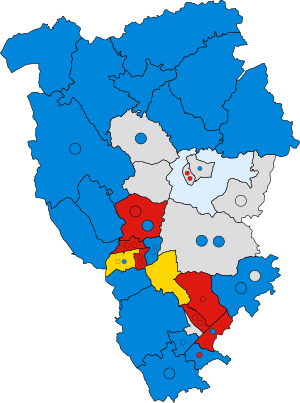 Winner of each seat at the 1979 Braintree District Council election |
Council control before election
Conservative
| Council control after election
No overall control
| |
The 1979 Braintree District Council election took place on 3 May 1979 to elect members of Braintree District Council in England.[1] This was on the same day as the 1979 UK general election and other local elections across the United Kingdom.
At the election, the Conservatives lost control of the council to no overall control despite remaining the largest party.
Summary
Election result
1979 Braintree District Council election | Party | Seats | Gains | Losses | Net gain/loss | Seats % | Votes % | Votes | +/− |
| | Conservative | 28 | 1 | 2 | 11 | 48.3 | 46.5 | 54,148 | –1.5 |
| | Labour | 17 | 0 | 0 | 9 | 29.3 | 36.5 | 42,436 | +2.5 |
| | Independent | 7 | 0 | 1 | 1 | 12.1 | 5.2 | 6,068 | –3.8 |
| | Liberal | 3 | 1 | 0 | 2 | 5.2 | 8.5 | 9,855 | +2.3 |
| | Residents | 2 | 1 | 0 | 1 | 3.4 | 2.4 | 2,797 | ±0.0 |
| | Ind. Conservative | 1 | 0 | 0 | | 1.7 | 0.4 | 408 | N/A |
| | Independent Liberal | 0 | 0 | 0 | | 0.0 | 0.4 | 484 | +0.2 |
| | Communist | 0 | 0 | 0 | | 0.0 | 0.1 | 173 | –0.1 |
Ward results
Black Notley
Black Notley | Party | Candidate | Votes | % | ±% |
| | Conservative | E. Mills | 821 | 75.3 | +1.1 |
| | Labour | D. Beardwell | 270 | 24.7 | –1.1 |
| Majority | 551 | 50.5 | +2.0 |
| Turnout | 1,091 | 75.8 | +32.8 |
| Registered electors | 1,412 | | |
| | Conservative hold | Swing | 1.1 | |
Bocking North
Bocking North | Party | Candidate | Votes | % |
| | Labour | A. Millam | 1,569 | 49.7 |
| | Labour | J. Hall | 1,514 | 48.0 |
| | Conservative | E. Davis | 1,470 | 46.6 |
| | Labour | C. Sheret | 1,441 | 45.7 |
| | Conservative | B. Steel | 1,428 | 45.3 |
| | Conservative | S. Brown | 1,407 | 44.6 |
| Turnout | 3,155 | 75.0 |
| Registered electors | 4,207 | |
| | Labour win (new seat) |
| | Labour win (new seat) |
| | Conservative win (new seat) |
Bocking South
Bocking South | Party | Candidate | Votes | % |
| | Labour | G. Warne | 1,753 | 53.8 |
| | Labour | A. Mackenzie | 1,568 | 48.1 |
| | Labour | R. Watson | 1,548 | 47.5 |
| | Conservative | A. Comfort | 1,456 | 44.7 |
| | Conservative | R. Perkin | 1,408 | 43.2 |
| | Conservative | T. Adcock | 1,396 | 42.8 |
| Turnout | 3,260 | 75.1 |
| Registered electors | 4,341 | |
| | Labour win (new seat) |
| | Labour win (new seat) |
| | Labour win (new seat) |
Braintree Central
Braintree Central | Party | Candidate | Votes | % |
| | Labour | G. Warren | 1,683 | 53.4 |
| | Labour | J. Perks | 1,594 | 50.6 |
| | Labour | M. Shirvington | 1,560 | 49.5 |
| | Conservative | B. Britten | 1,363 | 43.2 |
| | Conservative | D. Sayers | 1,338 | 42.4 |
| | Conservative | J. Moll | 1,277 | 40.5 |
| Turnout | 3,152 | 73.9 |
| Registered electors | 4,265 | |
| | Labour win (new seat) |
| | Labour win (new seat) |
| | Labour win (new seat) |
Braintree East
Braintree East | Party | Candidate | Votes | % |
| | Conservative | P. Gilthorpe | 1,399 | 40.3 |
| | Conservative | J. Amies | 1,331 | 38.3 |
| | Conservative | A. Plumb | 1,310 | 37.7 |
| | Labour | M. Oliver | 1,097 | 31.6 |
| | Labour | C. Oliver | 1,079 | 31.1 |
| | Labour | P. Woollard | 1,004 | 28.9 |
| | Liberal | R. Allen | 875 | 25.2 |
| | Liberal | K. Webb | 820 | 23.6 |
| | Liberal | I. Hamlin | 814 | 23.5 |
| Turnout | 3,471 | 76.0 |
| Registered electors | 4,567 | |
| | Conservative win (new seat) |
| | Conservative win (new seat) |
| | Conservative win (new seat) |
Braintree West
Braintree West | Party | Candidate | Votes | % |
| | Liberal | J. Ross | 1,881 | 51.0 |
| | Liberal | J. Bryan | 1,654 | 44.8 |
| | Conservative | S. Harper | 1,482 | 40.2 |
| | Liberal | P. Farnell | 1,460 | 39.6 |
| | Conservative | H. Everitt | 1,350 | 36.6 |
| | Conservative | C. Murcott | 1,254 | 34.0 |
| | Labour | M. Gore | 563 | 15.3 |
| | Labour | D. Green | 487 | 13.2 |
| Turnout | 3,689 | 79.7 |
| Registered electors | 4,629 | |
| | Liberal win (new seat) |
| | Liberal win (new seat) |
| | Conservative win (new seat) |
Bumpstead
Bumpstead | Party | Candidate | Votes | % | ±% |
| | Conservative | S. Drapkin | Unopposed |
| Registered electors | 1,276 | | |
| | Conservative hold |
Castle Headingham
Castle Headingham | Party | Candidate | Votes | % | ±% |
| | Conservative | P. Schwier | 592 | 54.6 | +9.2 |
| | Labour | J. Lynch | 493 | 45.4 | +8.7 |
| Majority | 99 | 9.1 | +0.4 |
| Turnout | 1,085 | 79.6 | +13.8 |
| Registered electors | 1,334 | | |
| | Conservative hold | Swing | 0.3 | |
No Independent Liberal candidate as previous (17.9%).
Coggeshall
Coggeshall | Party | Candidate | Votes | % | ±% |
| | Independent | W. Drake | 1,554 | 52.4 | +18.5 |
| | Conservative | D. Bellamy | 1,438 | 48.5 | +2.3 |
| | Conservative | D. McMillan | 1,397 | 47.1 | –1.5 |
| | Conservative | H. Portway | 1,132 | 38.2 | N/A |
| | Liberal | D. Sibley | 897 | 30.3 | –1.1 |
| | Labour | A. McCracken | 827 | 27.9 | +1.1 |
| Turnout | 2,963 | 79.5 | +31.5 |
| Registered electors | 3,727 | | |
| | Independent hold |
| | Conservative hold |
| | Conservative hold |
Colne Engaine & Greenstead Green
Cressing
Cressing | Party | Candidate | Votes | % | ±% |
| | Liberal | J. Chapman | 357 | 38.2 | N/A |
| | Conservative | E. Yockney | 336 | 36.0 | –13.9 |
| | Independent | A. Allen | 241 | 25.8 | –2.6 |
| Majority | 21 | 2.2 | N/A |
| Turnout | 934 | 76.6 | +30.5 |
| Registered electors | 1,212 | | |
| | Liberal gain from Conservative | Swing | N/A | |
No Labour candidate as previous (21.7%).
Earls Colne
Gosfield
Halstead Holy Trinity
Halstead Holy Trinity | Party | Candidate | Votes | % | ±% |
| | Residents | E. McDowell | 1,548 | 54.9 | N/A |
| | Labour | R. Mayes | 1,423 | 50.5 | +8.1 |
| | Labour | N. Bugbee | 1,209 | 42.9 | +11.2 |
| | Labour | M. Finken | 1,023 | 36.3 | –2.3 |
| | Conservative | C. Covell | 1,018 | 36.1 | –1.0 |
| | Conservative | D. Thompson | 921 | 32.7 | N/A |
| Turnout | 2,819 | 78.4 | –26.1 |
| Registered electors | 3,596 | | |
| | Residents gain from Conservative |
| | Labour hold |
| | Labour hold |
Halstead St. Andrew's
Halstead St. Andrew's | Party | Candidate | Votes | % | ±% |
| | Residents | M. Gage | 1,249 | 51.3 | +20.9 |
| | Conservative | O. Joyce | 1,150 | 47.2 | +13.8 |
| | Conservative | J. Mitchell | 727 | 29.9 | –1.1 |
| | Labour | K. Jones | 677 | 27.8 | +11.5 |
| | Labour | J. Atherton | 592 | 24.3 | +8.2 |
| Turnout | 2,434 | 77.2 | +22.2 |
| Registered electors | 3,153 | | |
| | Residents hold |
| | Conservative hold |
Hatfield Peverel
Hatfield Peverel | Party | Candidate | Votes | % | ±% |
| | Conservative | C. Leicester | 1,467 | 64.6 | +9.5 |
| | Conservative | D. Claydon | 1,404 | 61.8 | +9.2 |
| | Labour | O. Deane | 713 | 31.4 | +11.8 |
| | Labour | J. Brooke | 670 | 29.5 | +13.3 |
| Turnout | 2,272 | 77.0 | +22.2 |
| Registered electors | 2,950 | | |
| | Conservative hold |
| | Conservative hold |
No Independent candidate as previous (38.9%).
Kelvedon
Kelvedon | Party | Candidate | Votes | % | ±% |
| | Conservative | M. Edwards | 1,233 | 51.3 | +10.4 |
| | Conservative | E. Clarke | 1,171 | 48.7 | +19.7 |
| | Independent | J. De Denne Yule | 1,083 | 45.0 | +5.7 |
| | Conservative | S. Gibbs | 861 | 35.8 | +8.2 |
| | Labour | B. Sherratt | 707 | 29.4 | +9.6 |
| | Labour | D. Rogers | 693 | 28.8 | +9.6 |
| | Labour | R. Sherratt | 690 | 28.7 | N/A |
| | Ind. Conservative | P. Crowe | 408 | 17.0 | N/A |
| Turnout | 2,405 | 80.3 | +24.8 |
| Registered electors | 2,995 | | |
| | Conservative hold |
| | Conservative gain from Independent |
| | Independent hold |
No Independent (Andrews, Kentish) candidates as previous (54.6%, 36.0%).
Panfield
Panfield | Party | Candidate | Votes | % | ±% |
| | Conservative | R. Chandler | 735 | 74.8 | +15.5 |
| | Labour | B. Burden | 247 | 25.2 | –15.5 |
| Majority | 488 | 49.7 | +31.1 |
| Turnout | 982 | 82.0 | +22.3 |
| Registered electors | 1,205 | | |
| | Conservative hold | Swing | 15.5 | |
Rayne
Rayne | Party | Candidate | Votes | % | ±% |
| | Conservative | C. Crossman | 1,017 | 74.2 | +8.8 |
| | Labour | E. Hall | 353 | 25.8 | +11.2 |
| Majority | 664 | 48.5 | +3.1 |
| Turnout | 1,370 | 79.4 | +26.3 |
| Registered electors | 1,707 | | |
| | Conservative hold | Swing | 1.2 | |
No Liberal candidate as previous (20.0%).
Sible Headingham
Sible Headingham | Party | Candidate | Votes | % | ±% |
| | Independent | G. Tanner | Unopposed |
| | Conservative | H. Hall | Unopposed |
| Registered electors | 2,430 | | |
| | Independent hold |
| | Conservative hold |
Stour Valley Central
Stour Valley Central | Party | Candidate | Votes | % | ±% |
| | Conservative | K. Nott | Unopposed |
| Registered electors | 1,161 | | |
| | Conservative hold |
Stour Valley North
Stour Valley North | Party | Candidate | Votes | % | ±% |
| | Conservative | C. Basham | Unopposed |
| Registered electors | 1,095 | | |
| | Conservative hold |
Stour Valley South
| Party | Candidate | Votes | % | ±% |
| | Conservative | R. Clark | Unopposed |
| Registered electors | 1,457 | | |
| | Conservative hold |
Terling
Terling | Party | Candidate | Votes | % | ±% |
| | Conservative | G. Isted | 720 | 73.8 | –4.2 |
| | Labour | J. Ness | 255 | 26.2 | +4.2 |
| Majority | 465 | 47.7 | –8.3 |
| Turnout | 975 | 76.7 | +36.2 |
| Registered electors | 1,243 | | |
| | Conservative hold | Swing | 4.2 | |
Three Fields
Three Fields | Party | Candidate | Votes | % | ±% |
| | Conservative | R. Hawkins | 1,183 | 57.6 | –5.8 |
| | Conservative | D. Platt | 951 | 46.3 | –11.4 |
| | Independent | J. Finbow | 825 | 40.1 | N/A |
| | Labour | J. Dyson | 627 | 30.5 | –9.9 |
| Turnout | 2,055 | 79.0 | +19.0 |
| Registered electors | 2,601 | | |
| | Conservative hold |
| | Conservative hold |
Upper Colne
Upper Colne | Party | Candidate | Votes | % | ±% |
| | Conservative | D. Johnson | Unopposed |
| Registered electors | 1,262 | | |
| | Conservative hold |
Witham Central
Witham Chipping Hill
Witham Chipping Hill | Party | Candidate | Votes | % |
| | Labour | A. Slowman | 1,091 | 51.8 |
| | Conservative | K. Richards | 1,007 | 47.8 |
| | Labour | D. Sabin | 891 | 42.3 |
| | Conservative | J. Dowding | 870 | 41.3 |
| Turnout | 2,107 | 77.5 |
| Registered electors | 2,719 | |
| | Labour win (new seat) |
| | Conservative win (new seat) |
Witham North
Witham North | Party | Candidate | Votes | % |
| | Labour | C. Edwards | 1,402 | 51.7 |
| | Labour | B. Boshell | 1,335 | 49.2 |
| | Labour | M. Fraser | 1,290 | 47.5 |
| | Conservative | A. Ager | 1,183 | 43.6 |
| | Conservative | T. Sheppard | 1,150 | 42.4 |
| | Conservative | D. Williams | 1,056 | 38.9 |
| Turnout | 2,713 | 76.0 |
| Registered electors | 3,570 | |
| | Labour win (new seat) |
| | Labour win (new seat) |
| | Labour win (new seat) |
Witham Silver End & Rivenhall
Witham Silver End & Rivenhall | Party | Candidate | Votes | % |
| | Labour | J. Evans | 1,168 | 54.6 |
| | Labour | J. Lyon | 1,153 | 53.9 |
| | Conservative | P. Cutmore | 979 | 45.8 |
| | Conservative | P. Digby | 864 | 40.4 |
| Turnout | 2,139 | 80.6 |
| Registered electors | 2,654 | |
| | Labour win (new seat) |
| | Labour win (new seat) |
Witham South
Witham South | Party | Candidate | Votes | % |
| | Conservative | J. Cooke | 1,170 | 39.6 |
| | Labour | K. Boylan | 1,140 | 38.6 |
| | Labour | B. Boshell | 1,123 | 38.0 |
| | Conservative | B. Smith | 1,109 | 37.5 |
| | Liberal | D. Bigg | 603 | 20.4 |
| | Liberal | A. Bigg | 494 | 16.7 |
| Turnout | 2,957 | 75.9 |
| Registered electors | 3,896 | |
| | Conservative win (new seat) |
| | Labour win (new seat) |
Witham West
Witham West | Party | Candidate | Votes | % |
| | Conservative | M. Lager | 1,000 | 55.5 |
| | Conservative | P. Gibbs | 999 | 55.5 |
| | Labour | R. Green | 757 | 42.0 |
| | Communist | F. Brown | 173 | 9.6 |
| Turnout | 1,801 | 74.4 |
| Registered electors | 2,421 | |
| | Conservative win (new seat) |
| | Conservative win (new seat) |
Yeldham
Yeldham | Party | Candidate | Votes | % | ±% |
| | Conservative | J. Yeldham | 614 | 60.3 | N/A |
| | Labour | T. Newton | 405 | 39.7 | N/A |
| Majority | 209 | 20.5 | N/A |
| Turnout | 1,019 | 80.9 | N/A |
| Registered electors | 1,249 | | |
| | Conservative hold | Swing | N/A | |
References
- ^ "Braintree District Council Election Results 1973 to 2011" (PDF). Colin Rallings and Michael Thrasher. www.electionscentre.co.uk. Retrieved 1 January 2023.

 28.3%)

 11
11 
 Council elections in Essex


