1976 United States presidential election in Rhode Island
 | ||||||||||||||||||||||||||
| Turnout | 76.4%[1] | |||||||||||||||||||||||||
|---|---|---|---|---|---|---|---|---|---|---|---|---|---|---|---|---|---|---|---|---|---|---|---|---|---|---|
| ||||||||||||||||||||||||||
 County Results County Results Municipality Results Municipality Results
| ||||||||||||||||||||||||||
| ||||||||||||||||||||||||||
The 1976 United States presidential election in Rhode Island took place on November 2, 1976, as part of the 1976 United States presidential election. Voters chose four representatives, or electors, to the Electoral College, who voted for president and vice president.
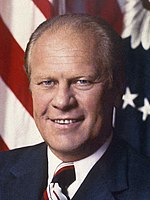
Rhode Island was won by Jimmy Carter (D–Georgia), with 55.36% of the popular vote. Carter defeated incumbent President Gerald Ford (R–Michigan), who finished with 44.08% of the popular vote. No third-party candidate received any votes.
Jimmy Carter went on to become the 39th president of the United States.[2]
Results
| Party | Candidate | Votes | % | |
|---|---|---|---|---|
| Democratic | Jimmy Carter | 227,636 | 55.36% | |
| Republican | Gerald Ford (inc.) | 181,249 | 44.08% | |
| Write-In | 2,285 | 0.56% | ||
| Total votes | 411,170 | 100% | ||
By county
| County | Jimmy Carter Democratic | Gerald Ford Republican | Various candidates Other parties | Margin | Total votes cast | ||||
|---|---|---|---|---|---|---|---|---|---|
| # | % | # | % | # | % | # | % | ||
| Bristol | 11,228 | 52.41% | 10,131 | 47.29% | 66 | 0.30% | 1,097 | 5.12% | 21,425 |
| Kent | 35,855 | 51.07% | 34,131 | 48.61% | 227 | 0.32% | 1,724 | 2.46% | 70,213 |
| Newport | 17,768 | 53.67% | 15,155 | 45.78% | 184 | 0.55% | 2,613 | 7.89% | 33,107 |
| Providence | 144,805 | 57.96% | 103,976 | 41.62% | 1,036 | 0.42% | 40,829 | 16.34% | 249,817 |
| Washington | 17,980 | 49.91% | 17,856 | 49.57% | 186 | 0.52% | 124 | 0.34% | 36,022 |
| Totals | 227,636 | 55.36% | 181,249 | 44.08% | 2,285 | 0.56% | 46,387 | 11.28% | 411,170 |
Counties flipped from Republican to Democratic
See also
References
- ^ This figure is calculated by dividing the total number of votes cast in 1976 (416,583) by an estimate of the number of registered voters in Rhode Island in 1976 (544,992). See "General Election November 2, 1976". Rhode Island Board of Elections. Retrieved February 6, 2018.
- ^ "Dave Leip's Atlas of U.S. Presidential Elections". uselectionatlas.org. Retrieved February 11, 2024.
 | This Rhode Island elections-related article is a stub. You can help Wikipedia by expanding it. |
- v
- t
- e


